July 2022
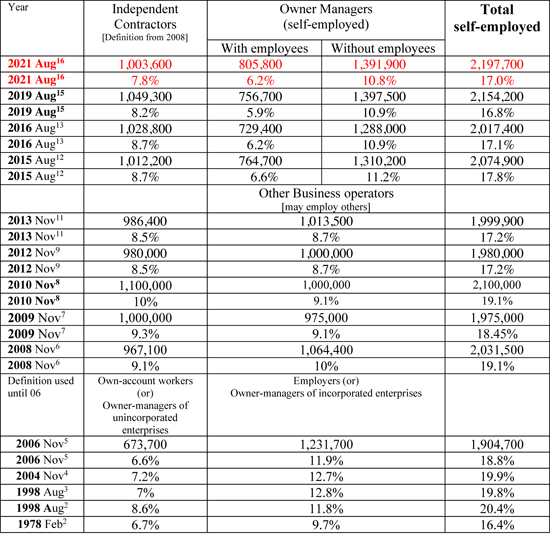
 Independent Contractors of Australia is frequently asked for statistics on the numbers of self-employed persons. The following statistics have been collated in response to those requests. ICA tracks these figures and updates them as new statistics become available. Self-employed people are people who work for themselves and who might either employ or not employ other people.
Summary
- 17 per cent of the Australian workforce are self-employed, which equates to 2.2 million persons. [2021]
When this is analysed further:
- 28 per cent of the private-sector workforce are self-employed. [NB: This is based on 2004 figures.1]
Self-employed persons

Total Workforce
| August 2021 | 12.9 million |
| August 2019 | 12.8 million |
| August 2016 | 11.8 million |
| August 2015 | 11.6 million |
| November 2013 | 11.6 million |
| November 2012 | 11.5 million |
| November 2010 | 11.3 million |
| November 2009 | 10.7 million |
| November 2008 | 10.6 million |
| November 2006 | 10.1 million |
| November 2004 | 9.6 million |
Percentage of workers (2017) in:
- Private sector 83.5%
- Public sector 16.5%
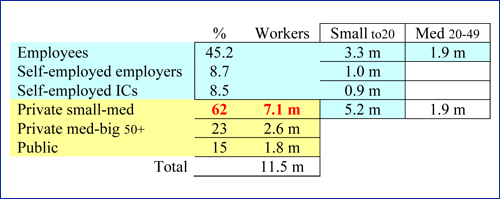
Of all businesses in Australia, 97% have between 1 and 19 people working in them.
Trade Union Membership
It’s interesting to compare trade union membership to self-employment. In August 2011,10 18% of the workforce were union members (about 2 million). By August 2018,14 this had declined to 14.6% of the workforce.

Source documents on independent contractor/self-employed numbers
The best and most reliable source of data on the numbers of self-employed people and independent contractors is the ABS. Since 2008, the Bureau has published data on both categories of workers at least every two years (sometimes more often). With the exception of the figures cited for 1978, all the figures presented in the “Self-employed persons” table (above) are taken from ABS publications.
In more recent years, the data for both the self-employed numbers and the number of of independent contractors have been available online. Typically published under the title “Characteristics of Employment, Australia“, four of the most recent links are:
- 2015: Table 3.1 (self-employed) and Table 14.1 (independent c0ntractors)
- 2016: Table 3.1 (self-employed) and Table 15.1 (independent c0ntractors)
- 2019: Table 7.3 (self-employed) and Table 9.1 (independent c0ntractors)
- 2021: Table 7.3 (self-employed) and Table 9.1 (independent c0ntractors)
Number of Australian Businesses 2011
Here are the latest Australian Bureau of Statistics figures on the number of businesses in Australia.
Note that 96 per cent of businesses are small.
- There were 2,132,412 actively trading businesses in Australia as at June 2011.
- The number of businesses grew by 3.6% during 2009-10 and 0.4% during 2010-11.
- The entry rate for new businesses during 2010-11 was 13.9%, significantly lower that the entry rate of 16.7% in 2009-10. The business exit rate was more stable: 13.1% in 2009-10 and 13.5% in 2010-11.
- Of the 2,073,793 businesses operating in June 2007, 84.6% were still operating in June 2008 and 73.5% were still operating in June 2009, 66.3% were still operating in June 2010 and 60.4% were still operating in June 2011.
- Of the 316,850 business entries during 2007-08, 71.5% were still operating in June 2009, 56.8% were still operating in June 2010 and 48.6% were still operating in June 2011.
- The greatest number of Australian businesses were in the construction industry (17%), followed by professional, scientific and technical services (12%) and rental, hiring and real estate services (11%).
- In 2009-10, every State and Territory recorded an increase in the number of businesses. In 2010-11, the only three States to record a decrease were Queensland, South Australia and Tasmania. All other States recorded an increase.
The vast majority (96%) of Australian businesses are small businesses (that is, they employ fewer than 20 people, including non-employing businesses).
ICA comment on November 2010-2012 self-employed figures
The ABS splits self-employed people into two categories; people who ‘supervise’ other people (other business operators) and people who don’t supervise anyone else (independent contractors). The ‘business operators’ are the traditional self-employed who employ someone—say a plumber with an apprentice or a shopkeeper with a couple of staff.
According to ABS data (6359.0 – Forms of Employment, Australia, November 2010), the self-employed in the workforce increased in both total numbers and percentage of the workforce during 2010.

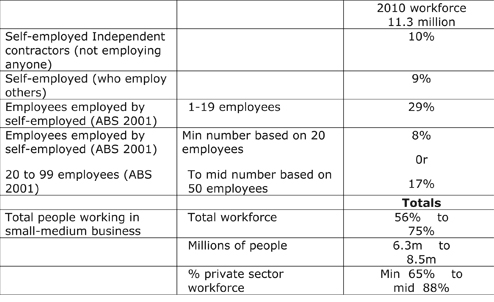
How many people are employed by self-employed people?
This specific data does not seem to be summarized by the ABS. But by combining ABS data from the ABS survey 2001 (1321.0 – Small Business in Australia, 2001)
and updating it to 2010, some estimates can be made as follows:
- 1.1 million self-employed people do not employ anyone.
- 1 million self-employed people do employ others.
When all self-employed people are combined with the employees who work in their businesses, up to 75 per cent of the total workforce (88 per cent of private sector) work in small and medium businesses. The following table shows how the figures are constructed.
 |
Australian Bureau of Statistics references:
Summary; Full.
ICA comment on November 2008 figures
The latest Australian Bureau of Statistics (ABS) figures are based on labour force statistics gathered in November 2008 and released in June 2009. They are available in PDF form here.
The figures are significant for two reasons:
-
-
- The number of self-employed people as a percentage of the workforce is proving stable over the medium term at around 19 per cent of the workforce. The actual number of self-employed people has increased marginally over the last few years as workforce numbers have increased.
- The 2008 ABS data uses revised methodology and sets of questions which ICA believes are improvements on the past. The new approach provides a more accurate picture of the self-employed community.
-
Why the revised methodology is an improvement
-
-
- In the past, the ABS labour force surveys seemed to use an approach that closed its eyes to the legal status of the self-employed. That is, the approach seemed to ignore the fact that self-employed people work under commercial arrangements and not employment contracts. This 2008 survey accepts that clear distinction and uses it as the basis for the survey methodology. This means that the ABS definitions are nowconsistent with the International Labour Organisation definitions, the Independent Contractors Act and definitions used under common law for workplace relations and related legislation.
- In the past, this simple distinction (commercial vs employment) was not used, it seems, because of a belief that questions could not be formulated that would make this distinction. However, this 2008 survey asks people to self-identify. ICA believes this is a logical approach which has proven successful in this survey. Most people who are self-employed (in a commercial arrangement) are very aware of the fact that they are in business and display this in their behaviour and attitudes.
-
Two ABS categories of self-employed
The 2008 survey splits the self-employed community into two broad categories:
-
-
- People who provide their time and labour and who only manage themselves. The ABS tags these people as “independent contractors”.
- People whose primary activity is managing others (have employees) and/or selling goods and services to earn income rather than relying on the provision of their labour. The ABS tags these people as “other business operators”.
-
ICA has always seen the terms ‘independent contractor’, ‘self-employed’, ‘micro/small business’, ‘consultant’, ‘freelancer’, etc., as highly interchangeable. The key identifier is the existence of commercial arrangements. It is the commercial fact that focuses ICA’s activities when arguing and discussing public policy issues. Nonetheless, the ABS
distinction between those who ‘manage and/or sell good/services’ and those who principally provide their ‘labour/time’ is a useful distinction which should aid future policy analysis.
The ‘other business operators’ are probably that group which most people think of when considering the self-employed—that is, a person running a shop, or selling something. This group probably doesn’t create a lot of confusion for policy analysts because they fit into a category of business that can be ‘seen’ and are tangible. They are the typical small
business.
The second category, ‘independent contractors’, is probably the group that cause most policy confusion because, for many observers, these people can appear to be ’employee-like’. It can be difficult to see this group as ‘being in business’ because there is often nothing tangible, such as a shop, for example, to point to. However, ICA believes that
these people are definitely in business and that their behavior and attitudes reflect this. What needs to be understood is that an individual can be a business. It is not necessary to have premises or sell goods to ‘be a business’. The ABS seems to have recognized this and accommodated it in its methodology.
Dependent contractor term removed
The 2008 ABS survey removes any identification of ‘dependent contractor’. This was an identifier used in previous ABS surveys. It has frequently been used by labour academics to suggest that there were independent contractors who were really employees. ICA has always argued that this was and is a legally and commercially illogical and false concept. It would be like arguing that there are ‘independent employees’. Both are concepts that confuse rather than assist policy analysis. The ABS seems to have dropped the use of the term ‘dependent contractor’, which is consistent with the dropping of the term by the ILO. ICA believes that removal of this term helps obtain greater clarity in data collection and its subsequent use for policy analysis.
Self-employed: Profiling
The 2008 survey provides interesting data for analytic purposes.
Of the 2.03 million self-employed people:
- 70 per cent are men.
- 50 per cent are aged between 35 and 54 years and 28 per cent are over the age of 55
- 54 per cent work more than 40 hours in a week
- 86 per cent have a say over their start/finish times
- 48 per cent work weekends
Of the almost one million ‘independent contractors’:
- 73 per cent have more than one contract at any one time.
- 79 per cent do not have employees
- 65 per cent are able to subcontract their work
Self-employed people are found in all areas of the economy, but heavier concentrations occur in construction, professional and scientific/technical areas, agriculture and the retail sector.
Comment
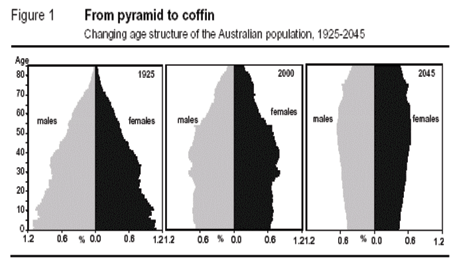
It is probable that, as the population ages (see graph below), more people are likely to be self-employed. It’s a lifestyle thing. When we are younger, we’re prepared to allow other people to dictate to us how we work. But as we mature, we become more experienced and sure of our business decisions. We want to control our own work and self-employment allows us to do this.
This will continue to present challenges for government and managers of employment-dependent firms. Governments will have to continue to review and improve their regulations to accommodate self-employed people. Firms will increasingly find that specialized and experienced talented people don’t want to be employed. Firms will have to discover how to engage and work with people on commercial contracts.

References
(1) Institute of Public Affairs: Just How Many Are There?
(2) Productivity Commission of Australia, Pub 2001, ISBN 1 74037 053 8
(3) Australian Bureau of Statistics, Pub 2000, Forms of Employment 6359.0
(4) Australian Bureau of Statistics, Pub 2005, Forms of Employment 6359.0
(5) Australian Bureau of Statistics, Pub 2007, Forms of Employment 6359.0
(6) Australian Bureau of Statistics, Pub 2009, Forms of Employment 6359.0
(7) Australian Bureau of Statistics, Pub 2010, Forms of Employment 6359.0
(8) ABS Media Release, November 2010.
(9) ABS Media Release, November 2012.
(10) Australian Bureau of Statistics, Pub 2011, Employee Earnings, Benefits and Trade Union Membership 6310.0, November 2012.
(11) Australian Bureau of Statistics, Pub 2013, Forms of Employment 6359.0
(12) ABS, Characteristics of Employment, Australia, August, 2015, Tables 3.1 and 14.1.
(13) ABS, Characteristics of Employment, Australia, August, 2016, Tables 3.1 and 15.1.
(14) http://www.abs.gov.au/ausstats/abs@.nsf/mf/6333.0, August 2018, Table 12.3.
(15) ABS, Characteristics of Employment, Australia, August, 2019. Tables 7.3 and 9.1.
(16) ABS, Characteristics of Employment, Australia, August 2021, Tables 7.3 and 9.1. Accessed from ‘Data downloads’ at: https://www.abs.gov.au/statistics/labour/earnings-and-working-conditions/characteristics-employment-australia/latest-release
Note
Due to the change in methodology by the ABS (discussed above), specific comparisons between 2008 data and pre-2008 data should be treated with caution. However, observation of general trends is possible.
In 2007 ICA was invited to make comment on the ABS methodology review. Many of ICA’s comments appear to have been incorporated in the 2008 methodology.